What is the Clonality Assessment?
The clonality assessment is a technique used to evaluate the similarity of cells/fibers based on their color profiles. It is taking advantage of multi-color systems generally used for fate mapping and lineage tracing strategies upon biological processes such as development and regeneration. Among those systems, the “Brainbow” mouse consists of the stochastic multi-color labelling of neuronal cells [1]. This technique relies on the Cre-Lox recombination system that allows the combination of multiple fluorophores within the cell of interest. Subsequently, this technique has been adapted to several other tissues and model organisms such as the Rainbow (for a variety of mice/mammalian tissues) [2], Flybow (for neural circuit analysis in Drosophila melanogaster) [3], CLoNe (for different tissues and species of mouse and chick) [4], and Zebrabow (for different zebrafish organs and tissues) [5]. Importantly, the Zebrabow system has been key in uncovering muscle stem cell dynamics upon growth and regeneration, through the concept of clonality. Tissue-resident stem cells have the capacity to self-renew and give rise to progenies committed to terminal differentiation. Upon their expansion, these cells will generate clones that are believed to share some genetic features, such as the initial color they have been attributed. In order to identify cells coming from a common progenitor, one has to be able to distinguish them from the randomly distributed ones.
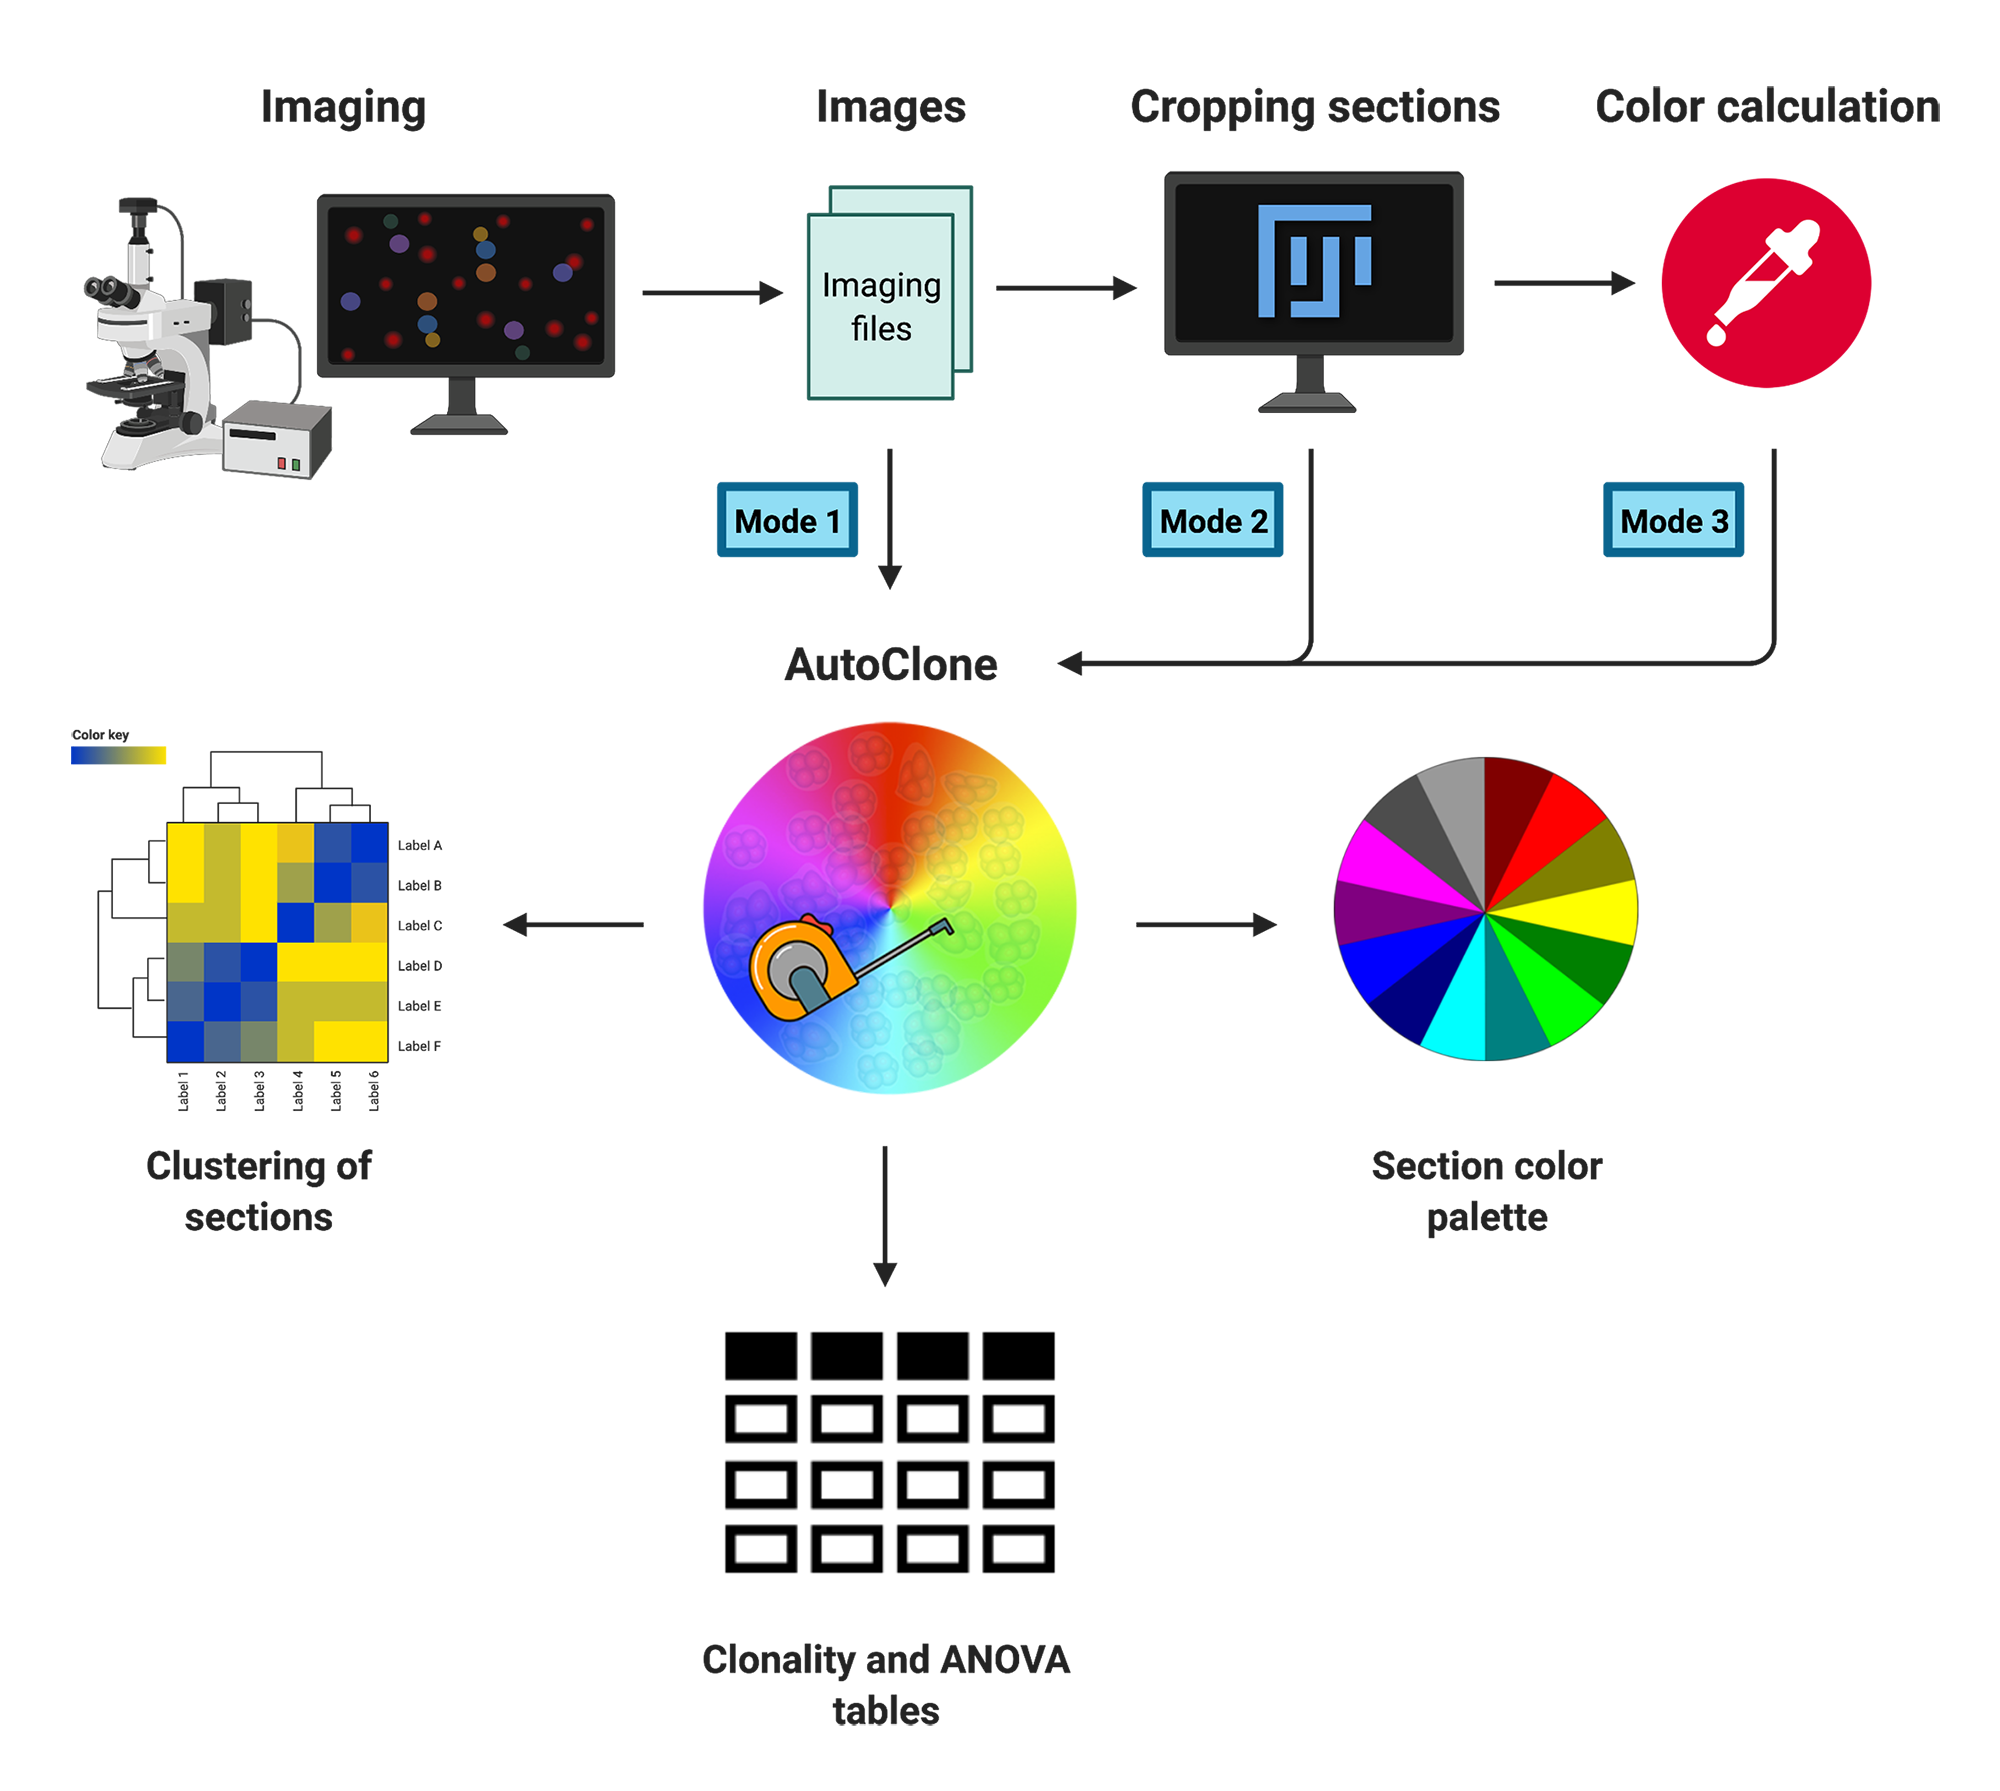
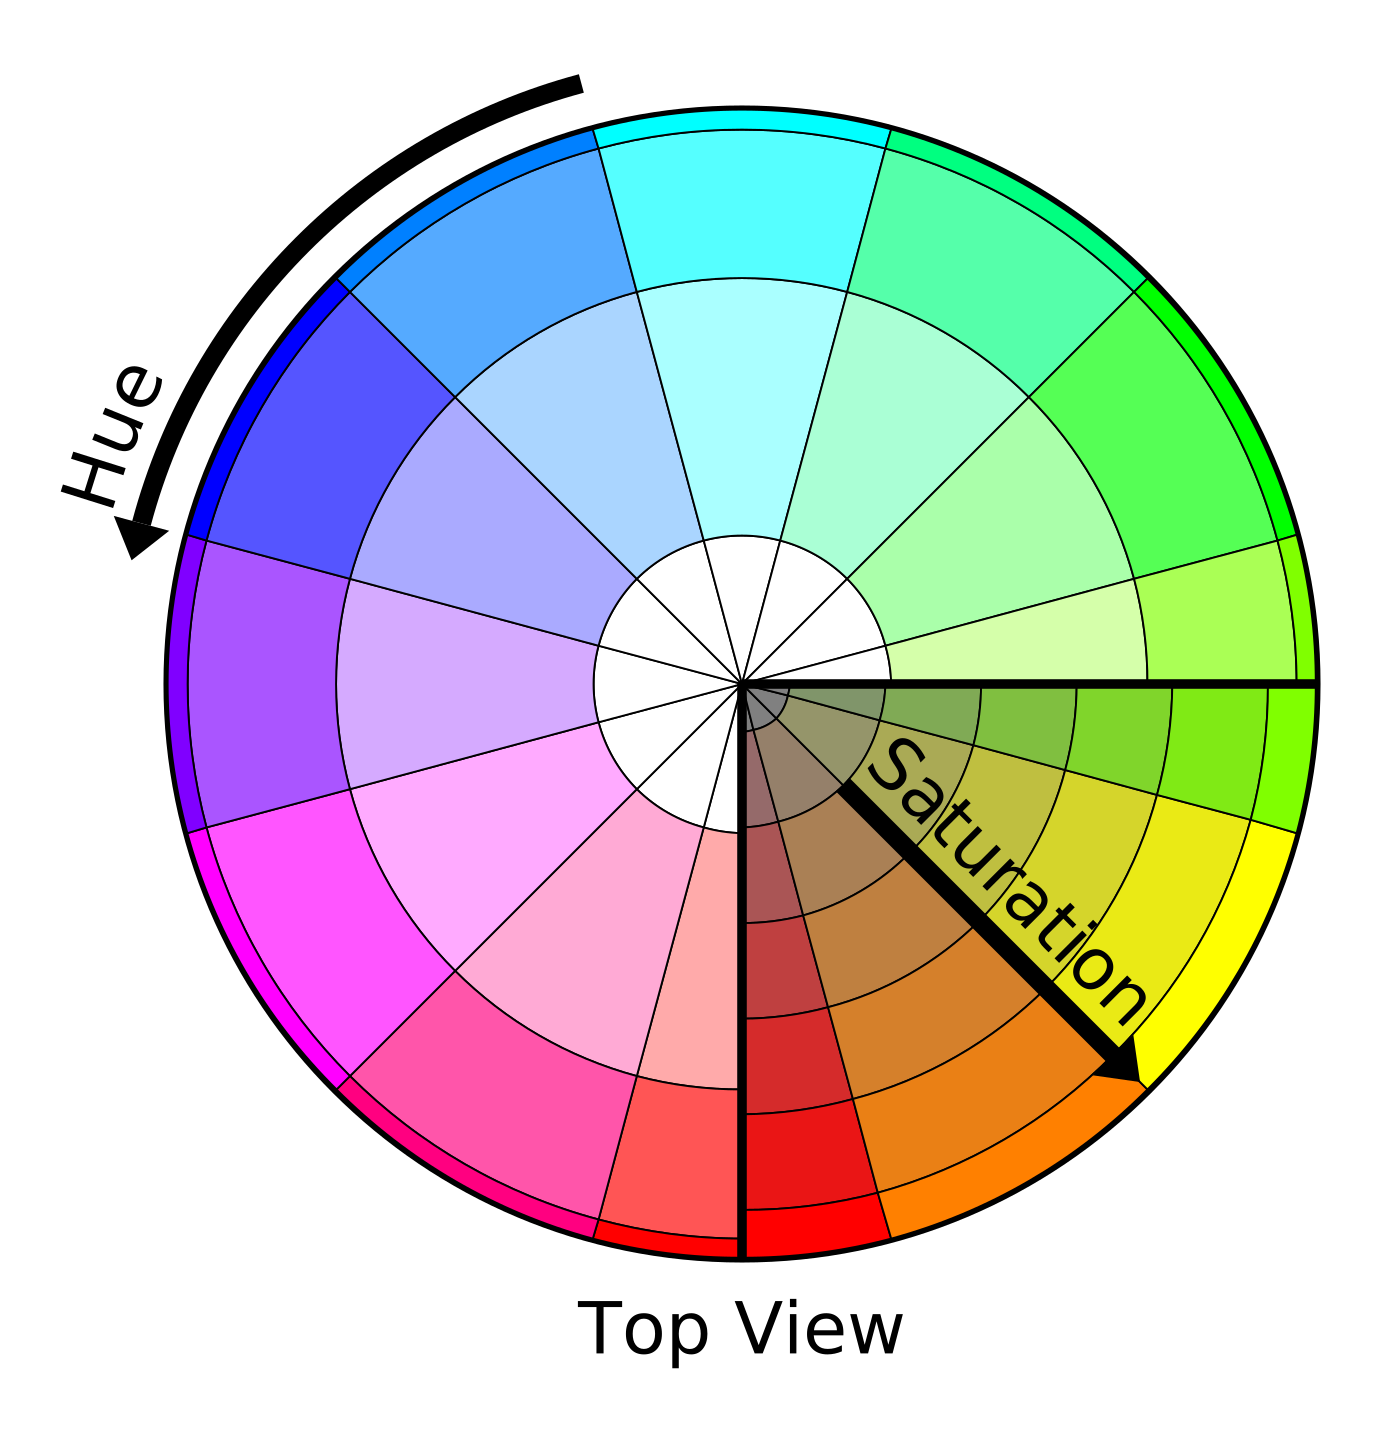
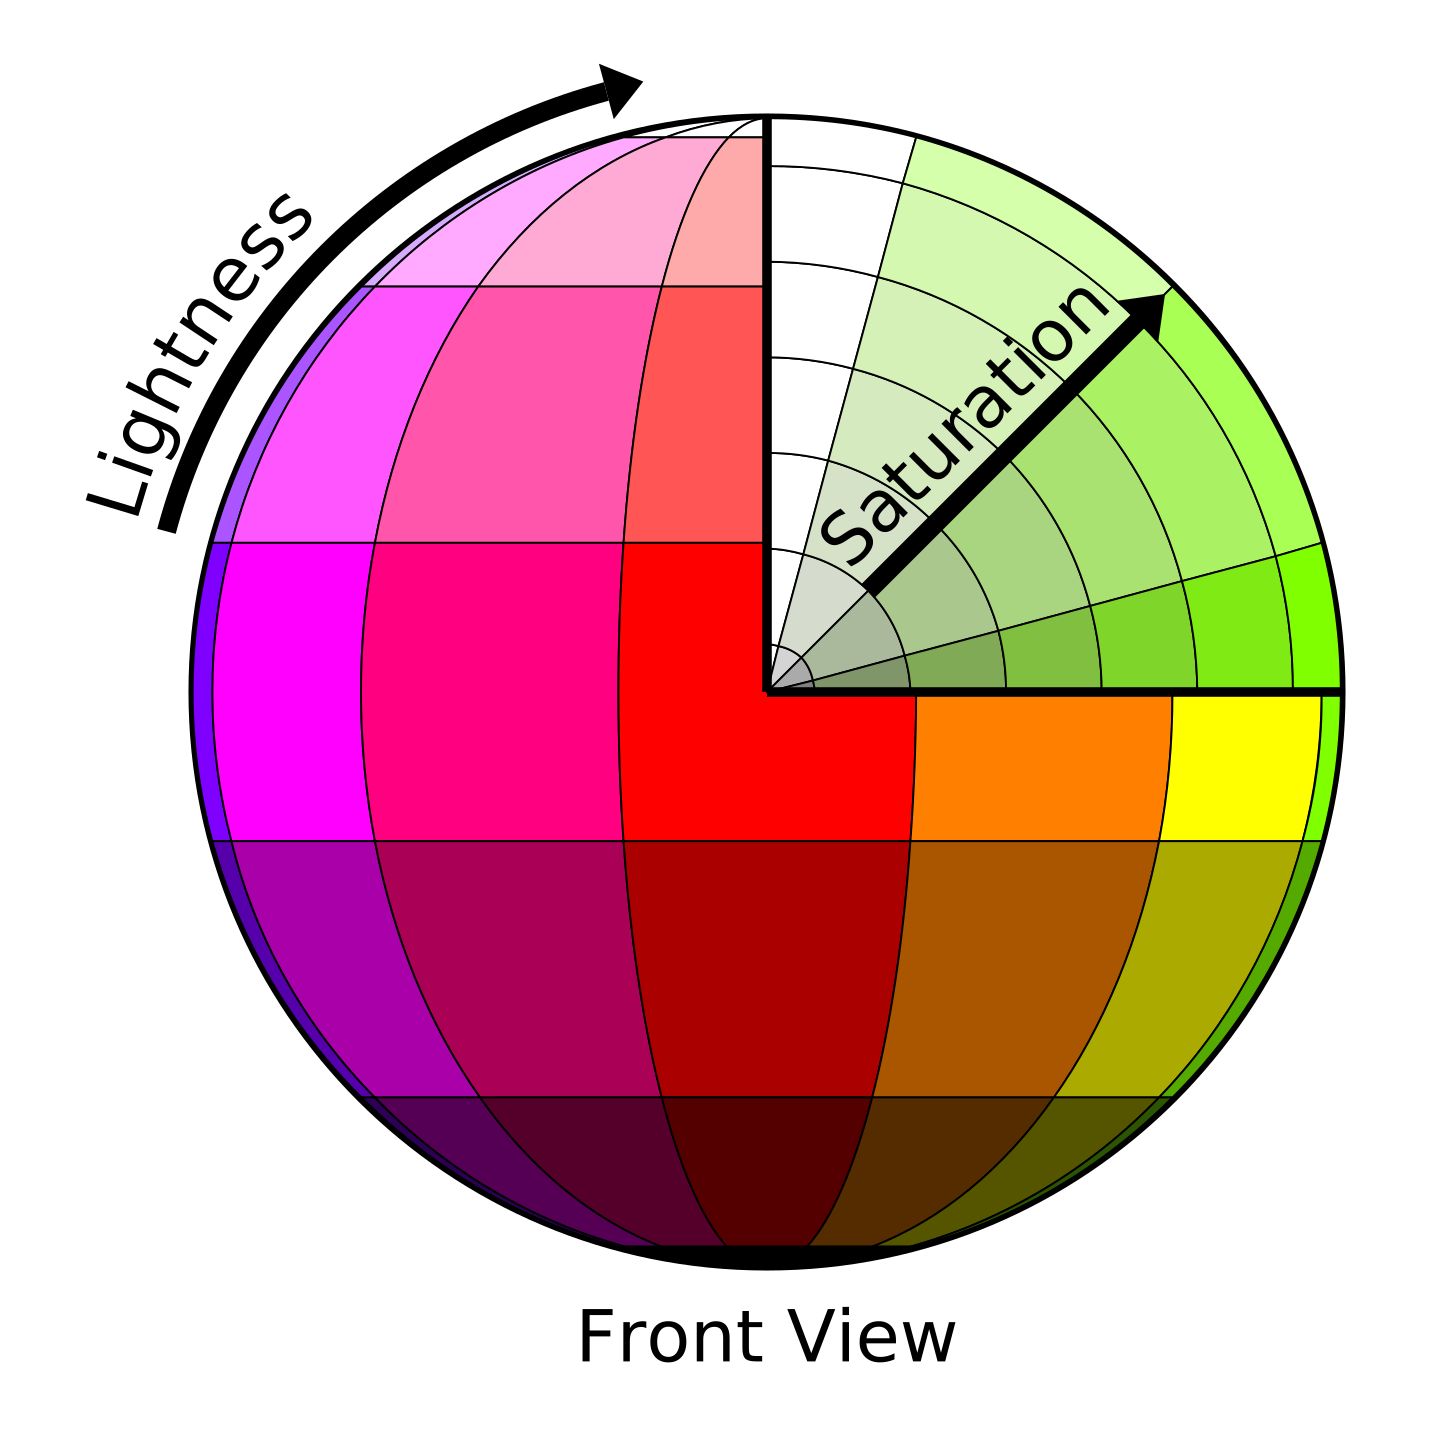
One of the important aspects of multi-colored lineage tracing systems is the quantification and statistical evaluation of the results (i.e. converting visual colors to interpretable statistics). In this regard, several methods have been proposed so far for color quantification and clonality assessment [6, 7]. Nguyen and Currie in a Methods paper [8] proposed a novel approach for quantifying the clonality and assessing multiple color profiles of clones, which enables the simultaneous comparison of the clonality of several clusters of cells/fibers. This approach works based on the translation of color values, such as Hue and Saturation, to trigonometric points with X and Y coordinates. Accordingly, to statistically evaluate the color similarity between individual clones, distances between two points (equivalent to cell or fiber) are calculated. While a high distance value between two points indicates a stochastic profile, a low mean distance corresponds to a clonal profile. In this approach, the three-channel (HSL) profile of the clones is converted to a 2D space color wheel. However, it is possible to maintain all three channels and convert the HSL to a 3D space color profile (i.e. converting Hue, Saturation, and Lightness values, to obtain X, Y and Z coordinates). The following figures [9] illustrate how colors could be transformed into coordinates in a 2D or 3D space. The AutoClone web app implements both of these approaches, namely 2D and 3D color space-based coordinate measuremant, to perform clonality assessment in three different modes which are illustrated in the right-hand side figure and are explained in the following three boxes.
Brush-based Mode
In the Brush-based mode of the app you can directly analyse your imaging files (in TIFF, PNG, or JPG format) whithout any preprocessing. You may just upload your imaging files and define your desired sections by brushing on the images using the toolset provided. A detailed workflow on how to perfoerm AutoClonization through the Brush-based mode is provided in the Brush-based tab. Click on the following button to go to the Brush-based tab.
Pre-cropped-based Mode
In the Pre-cropped-based mode of the app you can analyse your imaging section files (in TIFF, PNG, or JPG format) that you have previously generated. You may just upload your pre-cropped section files and performing the AutoClonization. A detailed workflow on how to perfoerm AutoClonization through the Pre-cropped-based mode is provided in the Pre-cropped-based tab. Click on the following button to go to the Pre-cropped-based tab.
Color/Coord-based Mode
In the Color/Coord-based mode of the app you can perform the AutoClonization based on the colors or coordinates you have previously generated for your desired sections. A detailed workflow on how to perfoerm AutoClonization through the this mode is provided in the Color/Coord-based tab. Click on the following button to go to the Color/Coord-based tab. Also, template file types are shown in the box below.
Color/Coordinate File Templates
The columns Image and Group are optional.
The columns Image and Group are optional.
The columns Image and Group are optional.
The columns Image and Group are optional.
The columns Image and Group are optional.
The columns Image and Group are optional.
Workflow
I. Select your desired image by clicking on its corresponding button in Step 1 .
II. Define a new section by clicking on the button New Section in Step 2 .
III. Select your desired clone of cells/fibers by dragging/brushing on the image in Step 2 .
IV. After you are happy with your selection, click on the button Approve Section in Step 2 .
V. Download the color scheme plots of your defind section in . Step 3 .
VI. Select your desired color space mode and perform autoclonization by clicking on the button Autoclonize in Step 4 .
VII. Download the Mean Distance plot and the table of Autoclonization results in Step 4 .
VIII. Download the RanCload statistics plot of sections distances in Step 5 .
IX. Download the section hierarchical clustering plot in Step 6 .
X. Download the table of ANOVA results in . Step 6 .
Input Image(s)
NOTE: If your images belong to several conditions ( e.g. test (mutant) versus control (wild type) samples), define the required groups by clicking on the following button.
Autoclonize
Click on the following button to calculate the clonality of all of the sections you defined in the previous step ( Step 2 ).
Define Sections
Click on your desired image button generated in Step 1 to illustrate it below.
NOTE: You can click on the maximize button on the top right corner of the box to have a look at the image at a larger scale before clone selection.
Distance Statistics
Visualize Section Palette
The number of defined sections are less than 3 and the clustering cannot be done!
Only a single section has been defined and the ANOVA cannot be done!
Workflow
I. Select your desired section image by clicking on its corresponding button in Step 1 .
II. Click on the button Approve Section in Step 2 .
III. Download the color scheme plots of your approved section in Step 3 .
IV. Select your desired color space mode and perform autoclonization by clicking on the button Autoclonize in Step 4 .
V. Download the Mean Distance plot in Step 4 .
VI. Download the table of Autoclonization results in Step 5 .
VII. Download the section hierarchical clustering plot in Step 6 .
Input Section Image(s)
NOTE: If your section images belong to several conditions ( e.g. test (mutant) versus control (wild type) samples), define the required groups by clicking on the following button.
Autoclonize
Click on the following button to calculate the clonality of all of the sections you defined in the previous step ( Step 2 ).
Approve Sections
Click on your desired section image button generated in Step 1 to illustrate it below.
Clonality Table
Visualize Section Palette
Color-based Clustering
The number of defined sections are less than 3 and the clustering cannot be done!
Workflow
I. Determine the type your input data, perform data reformatting (if required), and define the columns corresponding to the color/coord data in Step 1 .
II. Define the Section column and optionally Group and Image columns, and, finally, click on the button Preprocess the Data in Step 2 .
III. Selecet your desired sections and download their color scheme plots in . Step 3 .
IV. Select your desired color space mode and perform autoclonization by clicking on the button Autoclonize in Step 4 .
V. Download the Mean Distance plot and the table of Autoclonization results in Step 4 .
VI. Download the RanCload statistics plot of sections distances in Step 5 .
VII. Download the table of ANOVA results in . Step 6 .
Input Color/Coord File
Autoclonize
Click on the following button to calculate the clonality of the sections
Preprocessing
NOTE: If your data includes separate columns for image names and/or group names ( e.g. test (mutant) versus control (wild type) samples) corresponding to each section, define them below by clicking on the respective switch buttons.
Distance Statistics
Section Palette
Select your desired section below to visualize its pie color palette.
NOTE: The color palette visualization is not applicable to X and Y coordinates input file type.
ANOVA
Your input file includes only a single section and the ANOVA cannot be done!
 Salavaty.png)
Abbas (Adrian) obtained his B.Sc. and M.Sc. degrees in Molecular Genetics and Biology-Biochemistry, respectively. His Bachelor's project as well as his Master's thesis was purely computational. In this regard, he used both bioinformatics and systems biology approaches to acomplish these projects. He is now a bioinformatician and systems biologist pursuing his Ph.D. at the Australian Regenerative Medicine Institute (ARMI), Monash University.
More ...
Peter D. Currie received his PhD in Drosophila genetics from Syracuse University. He undertook postdoctoral training in zebrafish development at the Imperial Cancer Research Fund (now Cancer Research UK) in London, UK.. He has worked as a laboratory head at MRC Human Genetics Unit in Edinburgh and Victor Chang Cardiac Research Institute in Sydney. In 2016 he was appointed Director of Research of the ARMI at Monash University, Melbourne.
More ...

GET IN TOUCH
We appreciate your interest in the AutoClone web app. Use the form below to drop us an email.